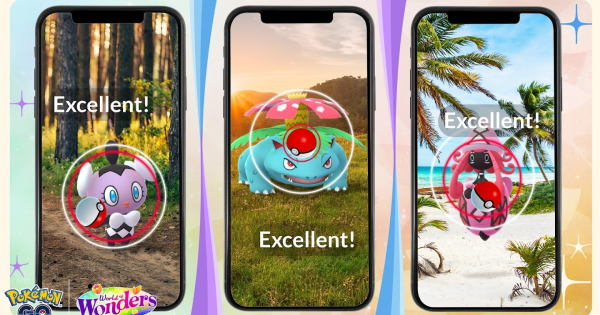

GamePress researchers had fun field testing the Pokemon GO Plus over the release weekend. In particular, we have been studying how catching with it compares with the existing catch mechanics. After data collection and statistical analysis, GamePress was able to confirm that:
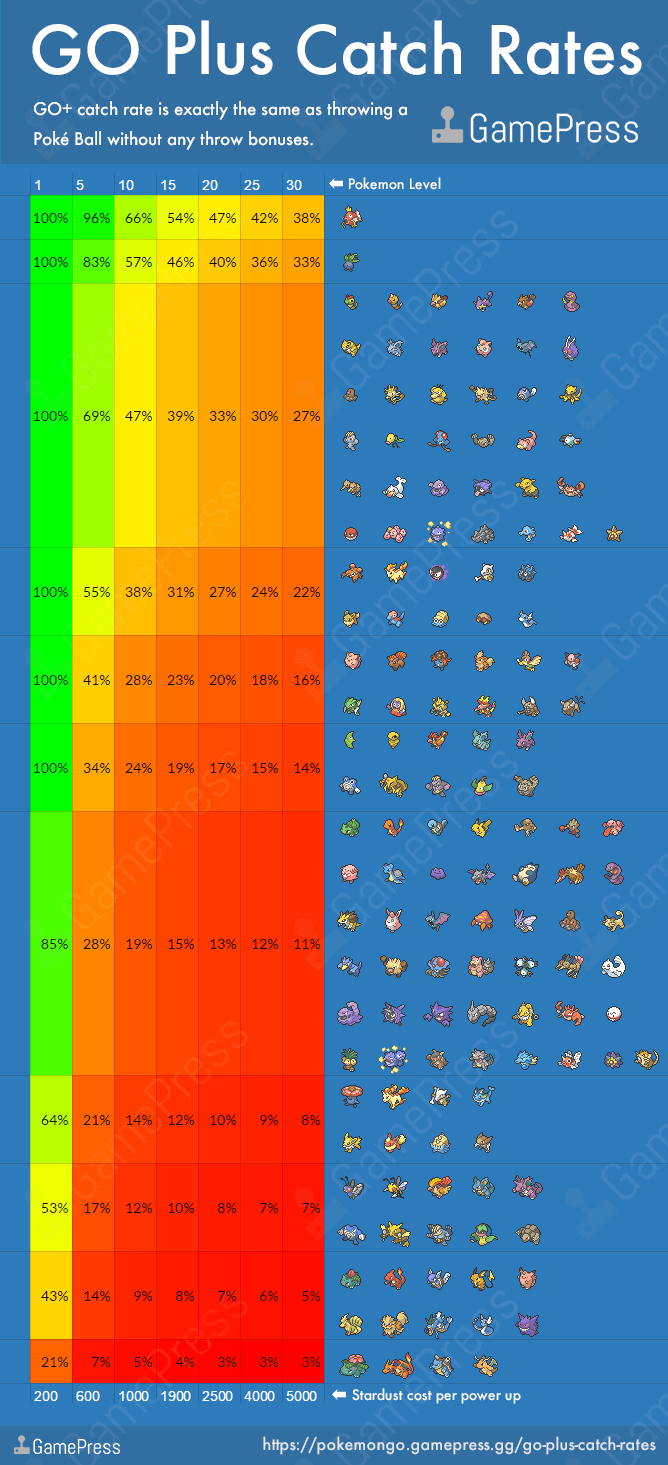
GO+ catch rate is exactly the same as throwing a Poké Ball without any throw bonuses: $$Capture Rate = \frac{Base Capture Rate}{2 * CP Multiplier} $$The only difference is with GO+, the Pokemon is guaranteed to flee if it breaks out. This infographic, therefore, serves as a handy catch-rate guide for GO Plus usage, as well as regular Poke Ball usage.
Expected Value is an averaged value of a variable, calculated as the sum of all possible values each multiplied by the probability of its occurrence.
$$E[x]= \sum_{i=1}^{N} x_i p_i$$If Pokemon GO Plus uses the pre-existing catch mechanics, then its simple catch rate ought to match the expected value of calculated capture rate, given a sufficiently large dataset.
$$SimpleCatchRate = \frac{Caught}{Caught+Flee}$$GamePress would like to thank Trainer Spidertotz for sharing his GO+ catch data with GamePress. We calculate the following from his data:
| Dataset | Spidertotz |
|---|---|
| Count | 257 |
| Simple Catch Rate | 52.16% |
| Expected Value | 52.00% |
| Standard Deviation | 3.13% |
| Sigmas | 0.1 |
We need to compare two functions:
- theoreticalCaptureRate(species, level) gives the probability of catching a pokemon at a certain level with one pokeball throw. It doesn't include bonuses or razzberries.
- experimentalCaptureRate(species, level) is the GO+'s capture rate, as measured from Spidertotz's experimental data. It's the measured probability of catching a pokemon using the Pokemon GO Plus.
The data suggests these are the same function, within a small margin of error. Here is the evidence.
First, note that for each of the data points we had, theoreticalCaptureRate(species, level) could be estimated from just the pokemon's CP and species. CP is a function of base stats and CpM (assuming average IVs), and CpM in turn is a function of level, so this can be inverted to solve for the pokemon level +/-2 from its CP and species without doing an IV analysis.
To estimate experimentalCaptureRate(species, level) is a bit harder, since you need a few data points at each pokemon level in order to find the percentage of pokemon caught as a function of level. To compare the functions, we first sorted Spidertotz's data by the pokemon's theoreticalCaptureRate. Then we binned the data into groups of 50, each with similar capture rates: for example, one group only had pokemon whose theoretical capture rate was between 29.94% and 32.67%. We then judged how well this bin fit the data by finding the experimental capture rate within the bin, $$NCaught/binsize$$ If the experimental capture rate of the pokemon which were binned within the 29.94% and 32.67% is close to the average theoretical capture rate of the pokemon within the bin, then the experimental data fits the theoretical capture rate formula well for that bin. It's a lot to swallow, but bear with me...
To display the results of the analysis, we plotted the experimental capture rate of a bin on the x axis and the same bin's average theoretical capture rate on the y axis. Each bin is one red dot. If the formulas match, the dots should resemble the equation y=x on a graph. So for reference y=x was also plotted. Looking at the graph below, it's clear that the points follow the line relatively well.
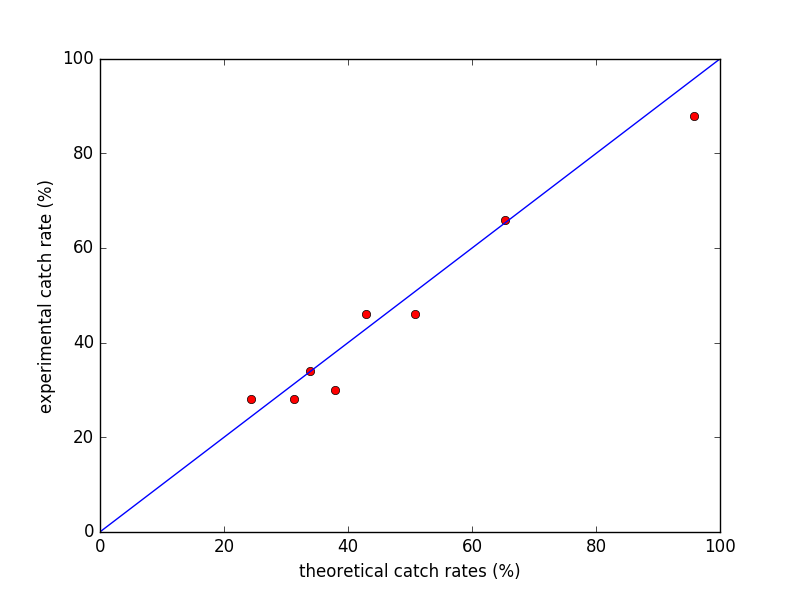
Above, in red dots: theoretical catch rate vs experimental catch rate. If they match, points should be near the line y=x.
Note: Not very much data was taken with very low capture rates, and to get a whole bin (50 points) full of low-caprate pokemon would take a long time since capture rate correlates with rarity. So technically we can't promise that the capture rate formula for the pokemon go plus continues to follow the capture rate of a single pokeball for super-rare pokemon. But considering this formula was made by a team of humans, it is very likely they just copied the formula since it's an easy solution; we've seen a lot of easy solutions with Niantic before, so we believe the pokeball formula holds over all pokemon species and levels.
GamePress would like to thank Trainer Gakushan, whose analysis is the basis for this section.
In Statistics, the binomial test is designed to test observations with only two outcomes - success or failure.
Catching with Pokemon GO Plus also only has two outcomes - the Pokemon is either caught, or it flees - making an ideal binomial test. Using the above dataset, we run the binomial test against every calculated capture rate that has 6 or more data points:
| Capture Rate | Catch | Flee | Total | Binomial Test |
|---|---|---|---|---|
| 29.94% | 3 | 3 | 6 | 93.00% |
| 31.22% | 5 | 5 | 10 | 94.31% |
| 31.92% | 5 | 7 | 12 | 84.94% |
| 32.67% | 3 | 7 | 10 | 57.73% |
| 33.48% | 4 | 6 | 10 | 78.39% |
| 35.29% | 5 | 2 | 7 | 99.06% |
| 36.31% | 2 | 7 | 9 | 30.75% |
| 37.43% | 3 | 9 | 12 | 28.41% |
| 38.66% | 2 | 6 | 8 | 34.41% |
| 40.01% | 0 | 6 | 6 | 4.66% |
| 41.52% | 4 | 5 | 9 | 70.09% |
| 47.34% | 2 | 4 | 6 | 39.49% |
| 50.05% | 2 | 5 | 7 | 22.57% |
| 53.30% | 4 | 2 | 6 | 85.65% |
| 57.27% | 3 | 3 | 6 | 51.21% |
| 68.91% | 6 | 2 | 8 | 76.57% |
| 78.21% | 7 | 1 | 8 | 86.00% |
| 87.20% | 5 | 1 | 6 | 56.03% |
| 92.71% | 11 | 0 | 11 | 100.00% |
| 100.00% | 24 | 0 | 24 | 100.00% |
Qualitatively, it's visible from the table that our number of catches always landed on the "correct side of the distribution", since most probabilities are over 50%. While the test is not conclusive on its own, this outcome would be unlikely if the pokeball caprate formula were inappropriate to describe our experimental data.